Market Analysis with VMC® GeoStatistics

Statistics by a Simple Mouse Click

Developing vehicles for global markets requires handling the variability of vehicle usage given by different profiles (commuter, taxi driver etc.), different driver characteristics as well as the geographic or regional variability (topography, climate/weather, road network …).

Statistics about types of roads, road quality, curviness, hilliness, traffic, urban and rural areas as well as legal restrictions, regulations and traffic signs are of particular importance when designing components and vehicles for durability or energy efficiency or when developing and verifying ADAS/AD functions. In addition, climate characteristics such as minimum and maximum temperature, sunshine hours, humidity, or others may be of interest, e.g., for the ageing of rubber bushings or the reliability of connectors and electronic devices.
 

Providing a Software Solution

VMC® GeoStatistics is a lean and transparent software solution to get insight into the above-mentioned environmental conditions. It provides an extensive worldwide data base and a suite of methods to support the engineer with fast and efficient analysis features.

Typical applications are:

  • Comparison of regions and markets worldwide with respect road properties such as curviness, hilliness, road type as well as other environmental properties e.g., climate
  • Assessment of routes and ranking with respect to its surrounding region
  • Planning of a measurement campaign and its route
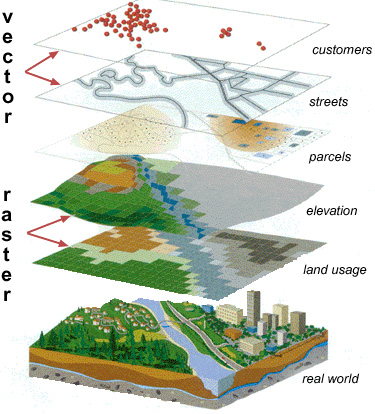
Various Layers of Geo-Referenced Data
© Fraunhofer ITWM
Various Layers of Geo-Referenced Data

Within Minutes You Find Reproducible and Transparent Answers for Questions Like:

  • Drive train development: Is the Vietnam road network more curvy (or hilly) than that of Thailand?
  • Energy efficiency: Does stop-and-go traffic in Rio de Janeiro differ from Tokyo?
  • Electronics/harness: How to cluster China for air humidity in different altitudes?
     

Especially, You Are Able To:

  • Easily compare two regions for relevant factors
  • Compare sets of routes to a region: »Is the measurement representative for the region?«
  • Compare two sets of routes, e.g. from salesman and commuters
  • Cluster sub regions for similar factors values: »How many climate zones (rainy days, daytime temperature, …) are relevant in India?«

VMC® GeoStatistics Features

  • Regional Analysis:
    • Road segmentation
    • Calculation of measures (curviness, hilliness, climate variables …)
    • Classification
    • Statistics and graphical evaluation
  • Route Analysis:
    • Import functions and map matching
    • Road segmentation
    • Calculation of measures (curviness, hilliness, climate variables …)
    • Classification
    • Statistics and graphical evaluation
    • Distance based analysis (properties as function of position on the route)
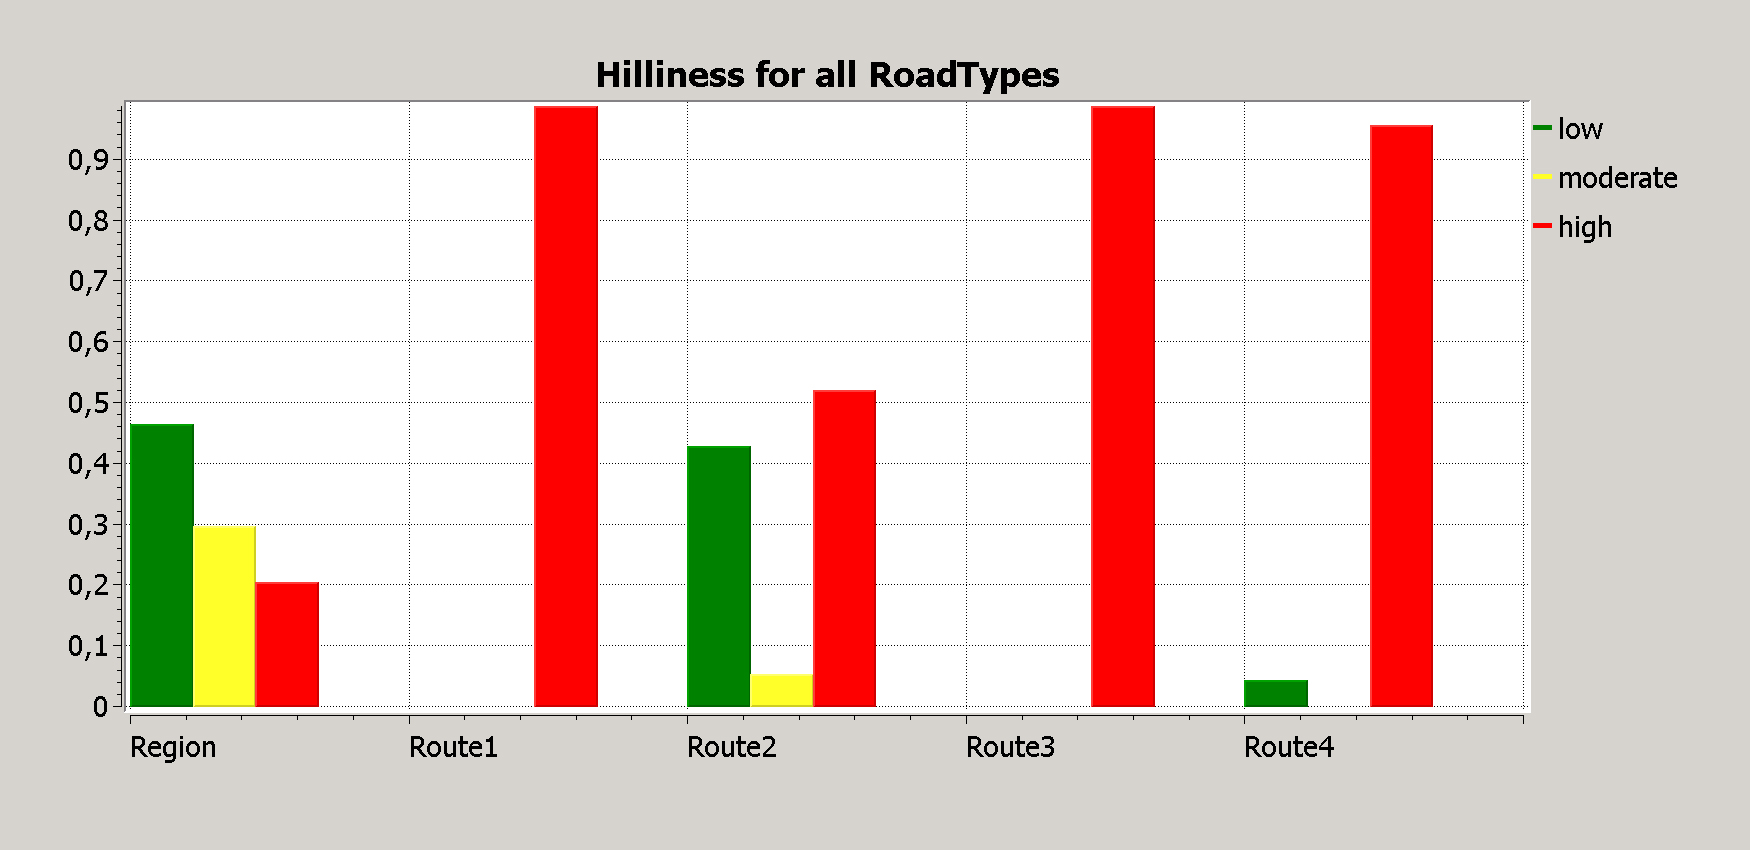
Histogram Comparing Regions with Specific Routes: Histogram Comparing Regions with Specific Routes: Distribution of Hilliness in Brazilian Road Network
© Fraunhofer ITWM
Histogram Comparing Regions with Specific Routes: Distribution of Hilliness in Brazilian Road Network
  • Representative Route Selection: 
    Detection of a small set of routes within a region covering all states of a certain measure (for instance hilliness)
  • Route Planning: 
    Generation of routes and analysis due to factor model definition
  • Data Export:
    Export segment tables for regions and routes
  • Configuration:
    Definition of factors and levels based on available measures
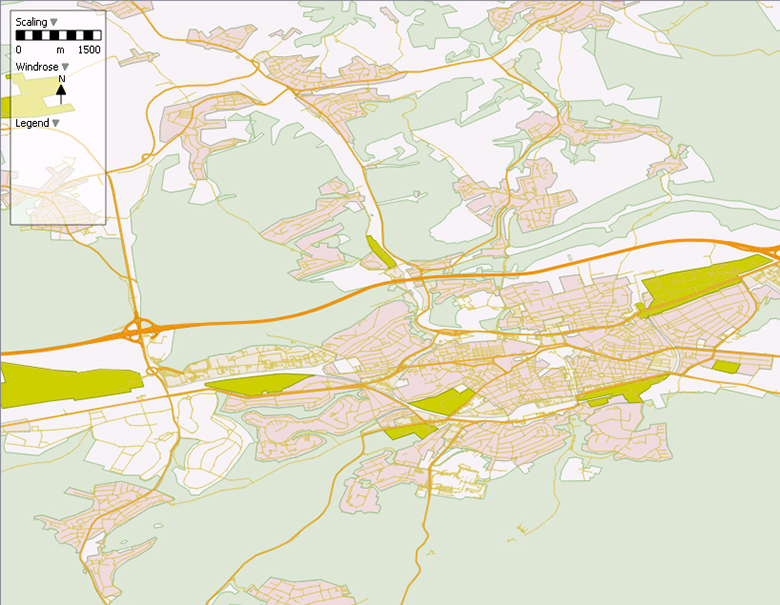
Screenshot Map Viewer: Screenshot Map Viewer: Roads and Land Use
© Fraunhofer ITWM
Screenshot Map Viewer: Screenshot Map Viewer: Roads and Land Use

The VMC® software heavily relies on the quality and completeness of the underlying data it works on. To capture the evolving road network in various regions of the world or enhancing properties which up to now are only partially available (e.g., roughness or traffic), the data is updated once a year.