U·Sim – Simulation of Vehicle Usage

U·Sim (Usage-Simulation) is the central tool within the process of deriving customer-oriented load distributions and design loads. Similarly, it can be applied to the analysis of energy efficiency (consumption and emission).

It combines a model for:

  • usage variability: Which operating states occur how often in a group of vehicle users?
  • load data: A couple of load observations, measured in each operating state to determine a load distribution for this group of users. 

Factor Models

An example for a factor model is

  • Factor road type with levels city, country, motorway
  • Factor payload with levels empty, medium, full
  • Factor topography with levels hilly and flat

An operating state is a combination of one level for each factor. The operating states are used to decompose the operation of a vehicle. The separation between vehicle usage, expressed in terms of frequencies of operating states, and vehicle loads, covered by a set of measurements within each operating state, is an effective approach to limit the effort of measuring to the statistically necessary amount and being able to simulate different groups of users by varying the usage model. 

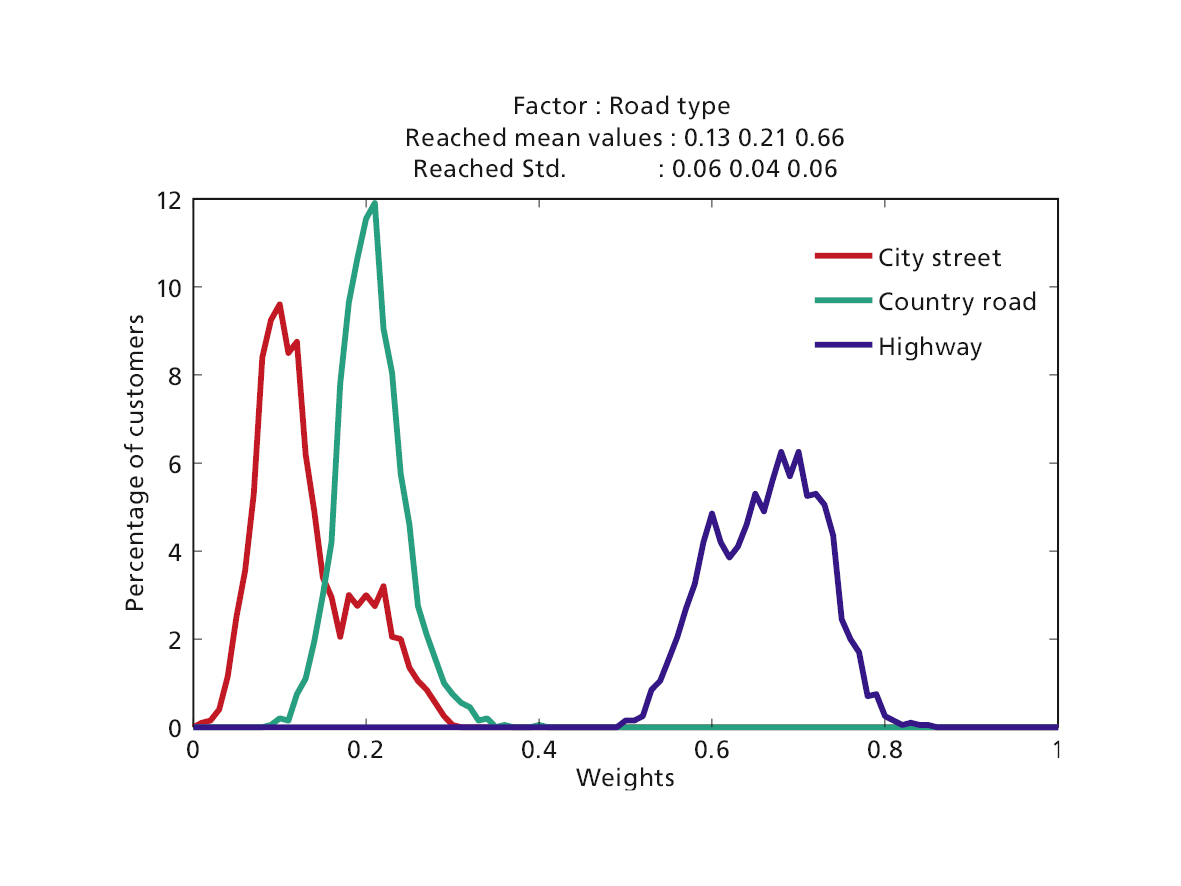
Simulated Weights for Factor Road Type
© Fraunhofer ITWM
Simulated Weights for Factor Road Type

The Basic Approach – Digital Twin Simulates Customer

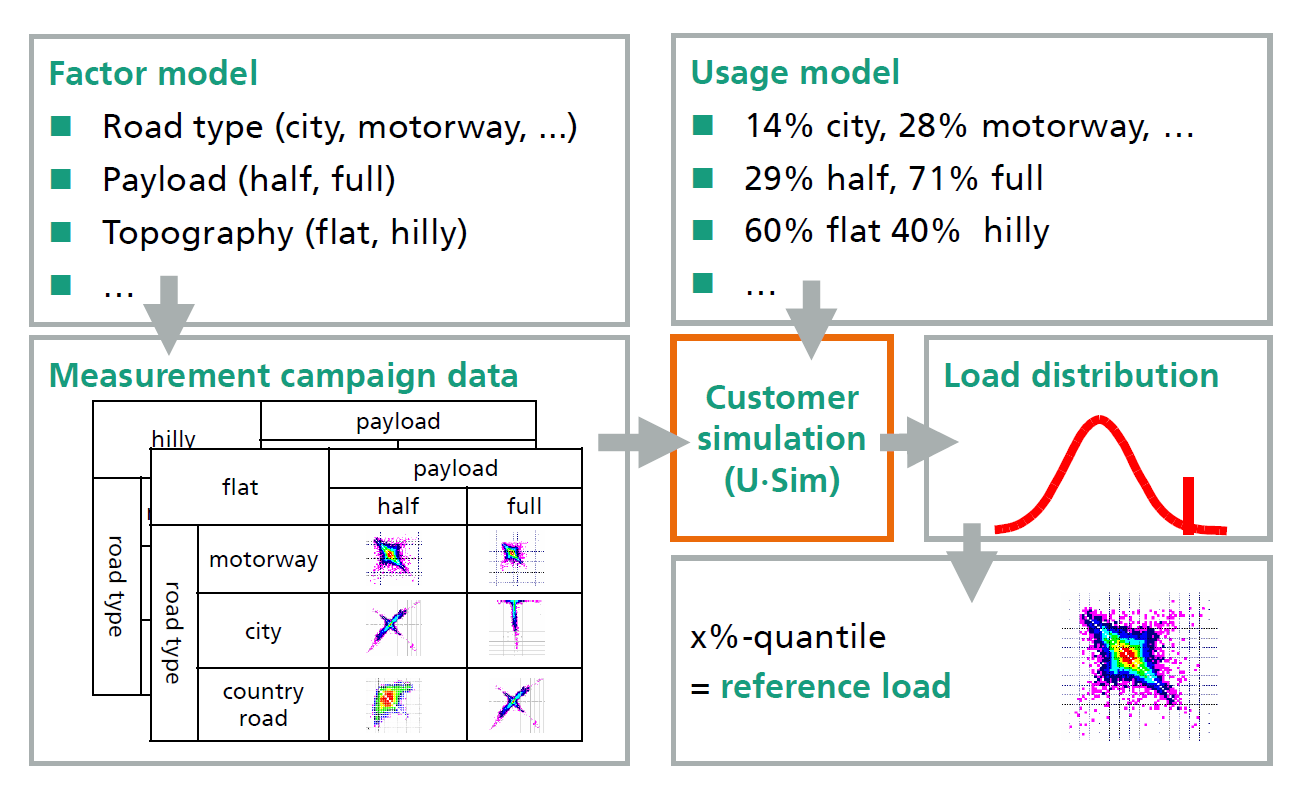
A large number of virtual customers is generated by a Monte Carlo simulation, which varies the frequencies of the operating states as well as the loads within an operating state across a large number of virtual vehicles. This results in empirical distributions for each measurement channel. A high quantile (e.g., 99 percent) may be extracted as a design load for further processing (component optimisation, mapping to the proving ground, or deriving test loads). Special manoeuvres (e.g., curb crossings) maybe added on request. 

Features of U·Sim

The software is easy to use. The usage model as well as the load data are defined via Excel sheets. The usage model parameters may be defined in a manual way based on rough assumptions about the vehicle’s usage (for instance from the sales department) or based on a more elaborate investigation (see VMS usage modelling). The Excel sheet for the load data has been automatically generated by VMC GeoLDA in advance. Both are imported and the empirical load distributions are generated with a few clicks. In particular, the following features are provided:

  • Definition of different customer groups and markets (populations) with different usage profiles
  • Monte Carlo simulation of many customers for a given usage profile
  • Determination of empirical distributions and quantile customers for freely selectable populations (one or more customer groups)
  • Sensitivity analyses for the parameters of the usage model
  • Rainflow superposition and extrapolation of quantile customers
  • Graphical evaluation of the input data, simulation results and quantile customers

Once the load distributions and design loads have been generated, the software U·SimOpt may be used to map the design load to a schedule on the proving ground. Additionally safety factors and rig tests can be defined in Jurojin with respect to the simulated load distributions

U·Sim process
© Fraunhofer ITWM
U·Sim process
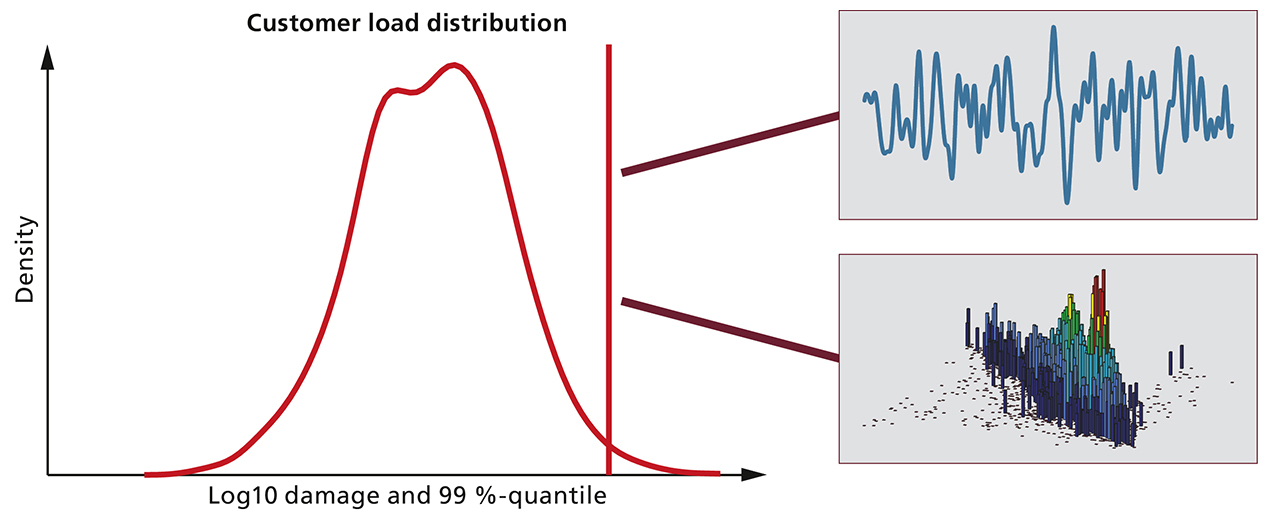
U-Sim Load Distribution
© Fraunhofer ITWM
Load Distribution and Quantile Customer with Rainflow and Time Series Representation
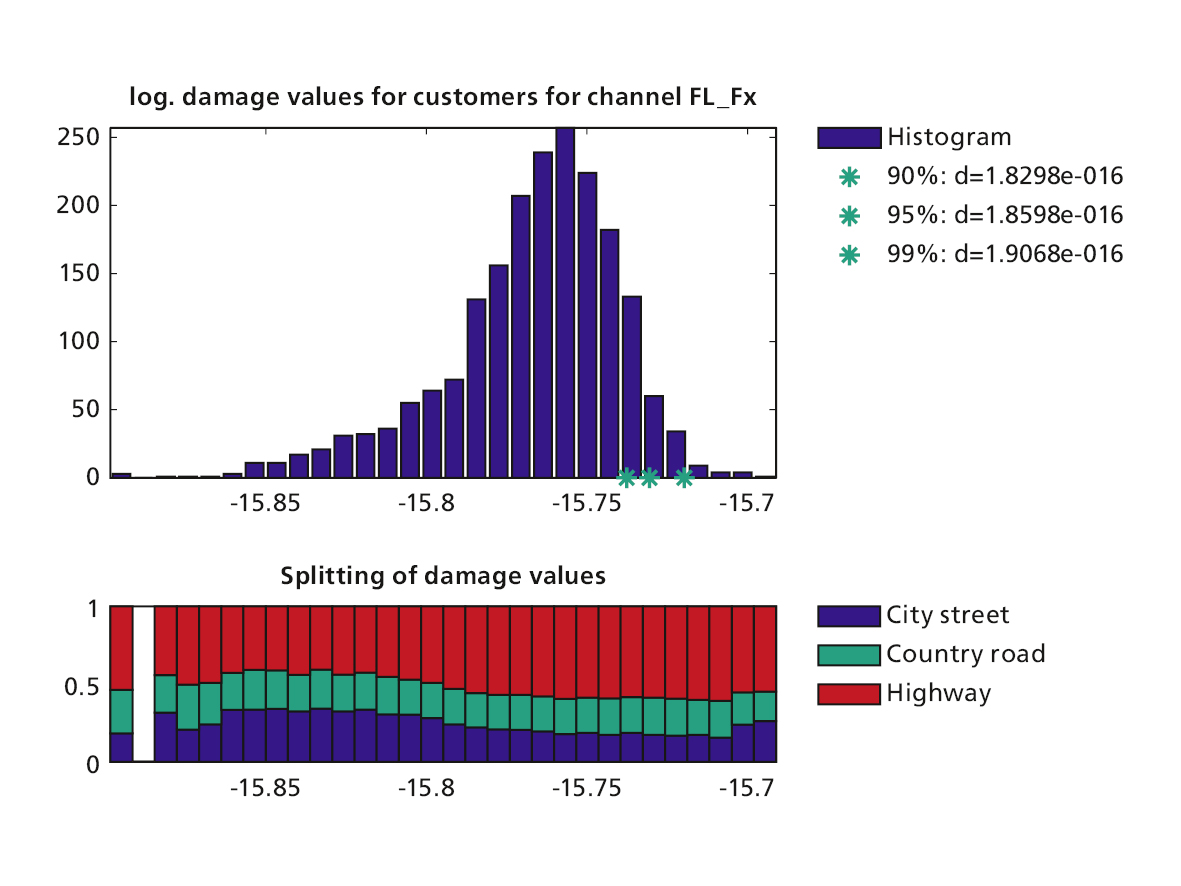
Damage Histogram and Decomposition with Respect to Factor Road Type
© Fraunhofer ITWM
Damage Histogram and Decomposition with Respect to Factor Road Type