Image Analysis for Fiber-Reinforced Polymers

The geometry of the fiber system of fiber-reinforced polymers has a strong impact on mechanical properties of composite parts. The mechanical properties of fiber-reinforced polymers are determined by their geometry to a large extent. Examples for important parameters include the spatial fiber arrangement and the fiber direction distribution. These and other characteristics can be computed from image data using specialized image analyses algorithms. Micro-computer tomography (µCT) is well-suited for a three dimensional characterization, but two dimensional imaging methods such as scanning acoustic microscopy (SAM) can also be used.

The software package MAVI includes a number of specialized, efficient algorithms for characterizing glass (GRP) or carbon fiber-reinforced polymers (CRP):

  • Local fiber volume density
  • Local and global orientation tensors
  • Mean fiber direction
  • Degree of anisotropy
  • Specific fiber length (total fiber length per unit volume)
  • Mean fiber diameter
  • Visualization of local fiber densities and directions
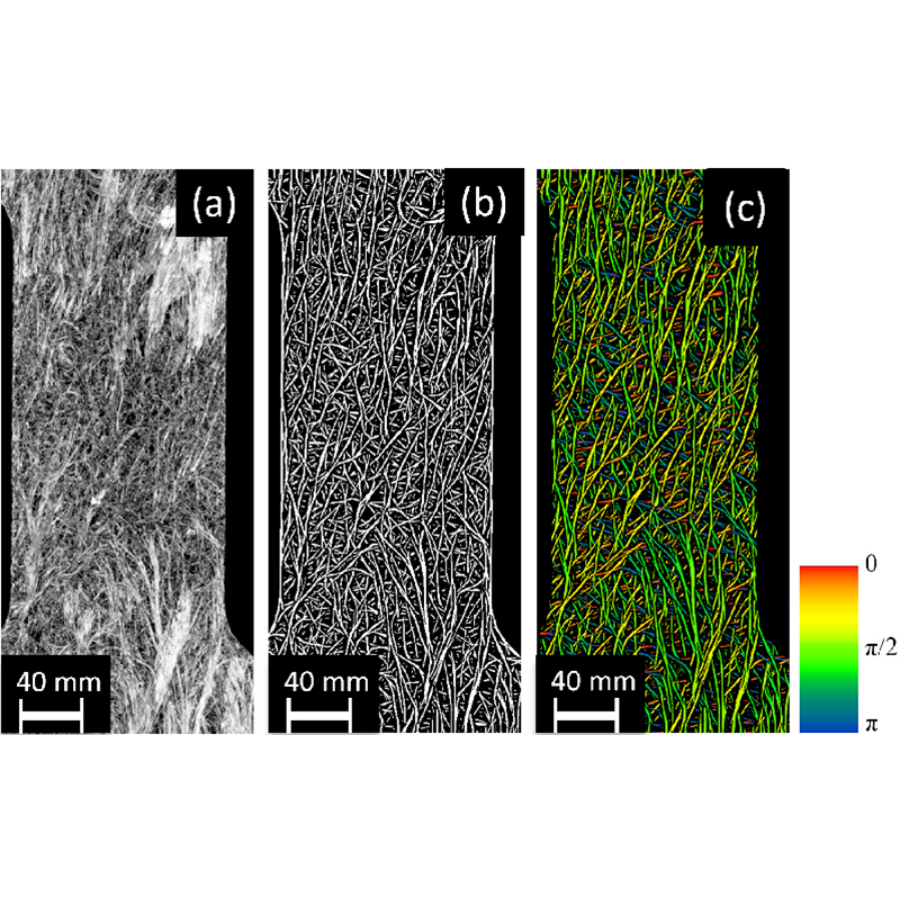
Orientation analysis for a scanning acoustic microscopy image of an SMC tensile test specimen with 30 wt% fibers. The shown slice (a) is 0.07 mm below the surface.  (b) segmented fiber system (white) and matrix (black). (c) color-coded local directions in each fiber pixel, 0° = vertical, 90° = horizontal.
© Visualization IVW Kaiserslautern
Orientation analysis for a scanning acoustic microscopy image of an SMC tensile test specimen with 30 wt% fibers. The shown slice (a) is 0.07 mm below the surface. (b) segmented fiber system (white) and matrix (black). (c) color-coded local directions in each fiber pixel, 0° = vertical, 90° = horizontal.
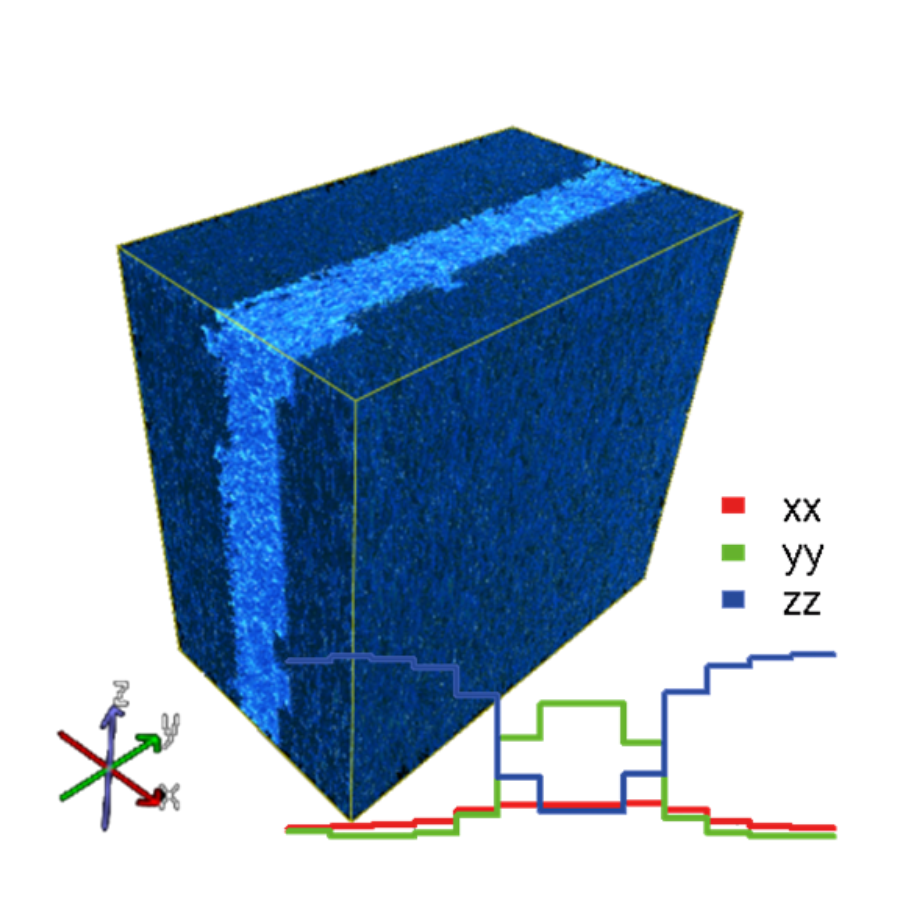
The measurements can be visualized by super-imposing the results onto the fiber system. Here, the central elements of the local orientation tensors were used (Sample and image source: IVW Kaiserslautern). A plot of the diagonal elements of the local fiber orientation tensors through the thickness of the specimen reveals a rearrangement of the fiber directions in the inner area due to rheological effects.
© ITWM
The measurements can be visualized by super-imposing the results onto the fiber system. Here, the central elements of the local orientation tensors were used (Sample and image source: IVW Kaiserslautern). A plot of the diagonal elements of the local fiber orientation tensors through the thickness of the specimen reveals a rearrangement of the fiber directions in the inner area due to rheological effects.
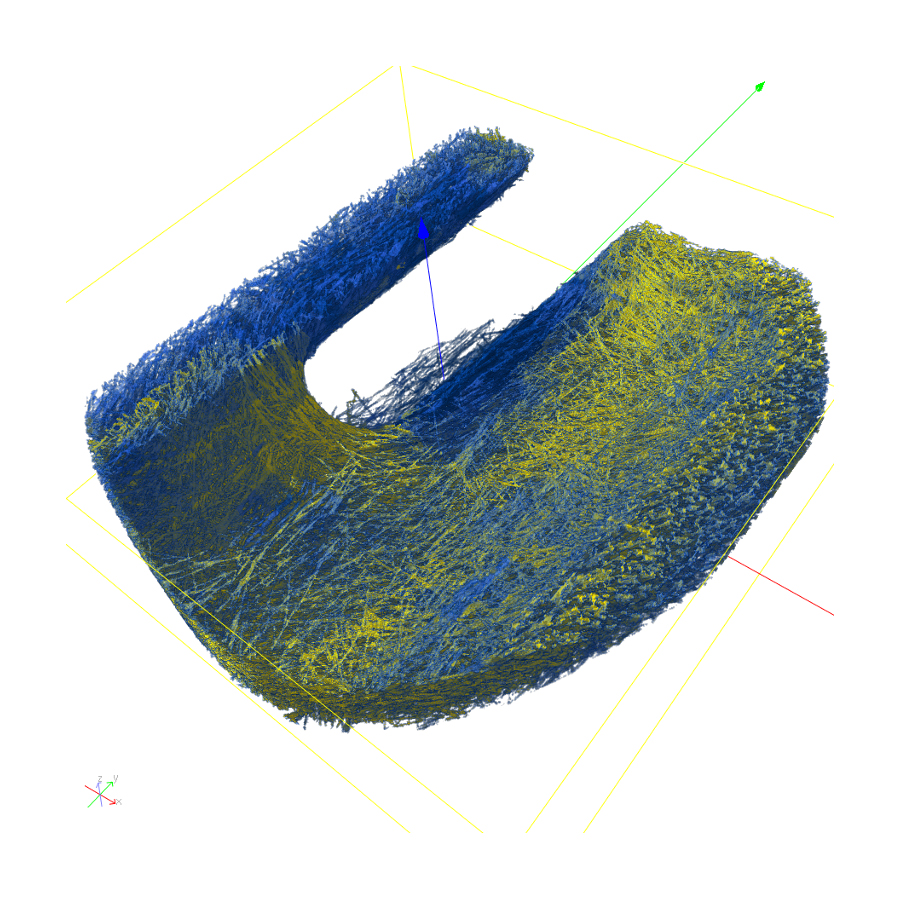
Analysis results for a region of interest CT data set of a break pipe clip. 3D visualization of local deviation fiber direction from global mean fiber direction. Yellow marks deviations larger than 20°.
© Fraunhofer ITWM
Analysis results for a region of interest CT data set of a break pipe clip. 3D visualization of local deviation fiber direction from global mean fiber direction. Yellow marks deviations larger than 20°.

With the help of these geometric parameters, the homogeneity of the fiber component and the expression of the desired fiber direction(s) can be tested. Furthermore, stochastic geometric models can be created. Geometries can be provided on voxel grids or in the form of surface meshes and are suitable for the calculation of structural mechanical properties of composites.  

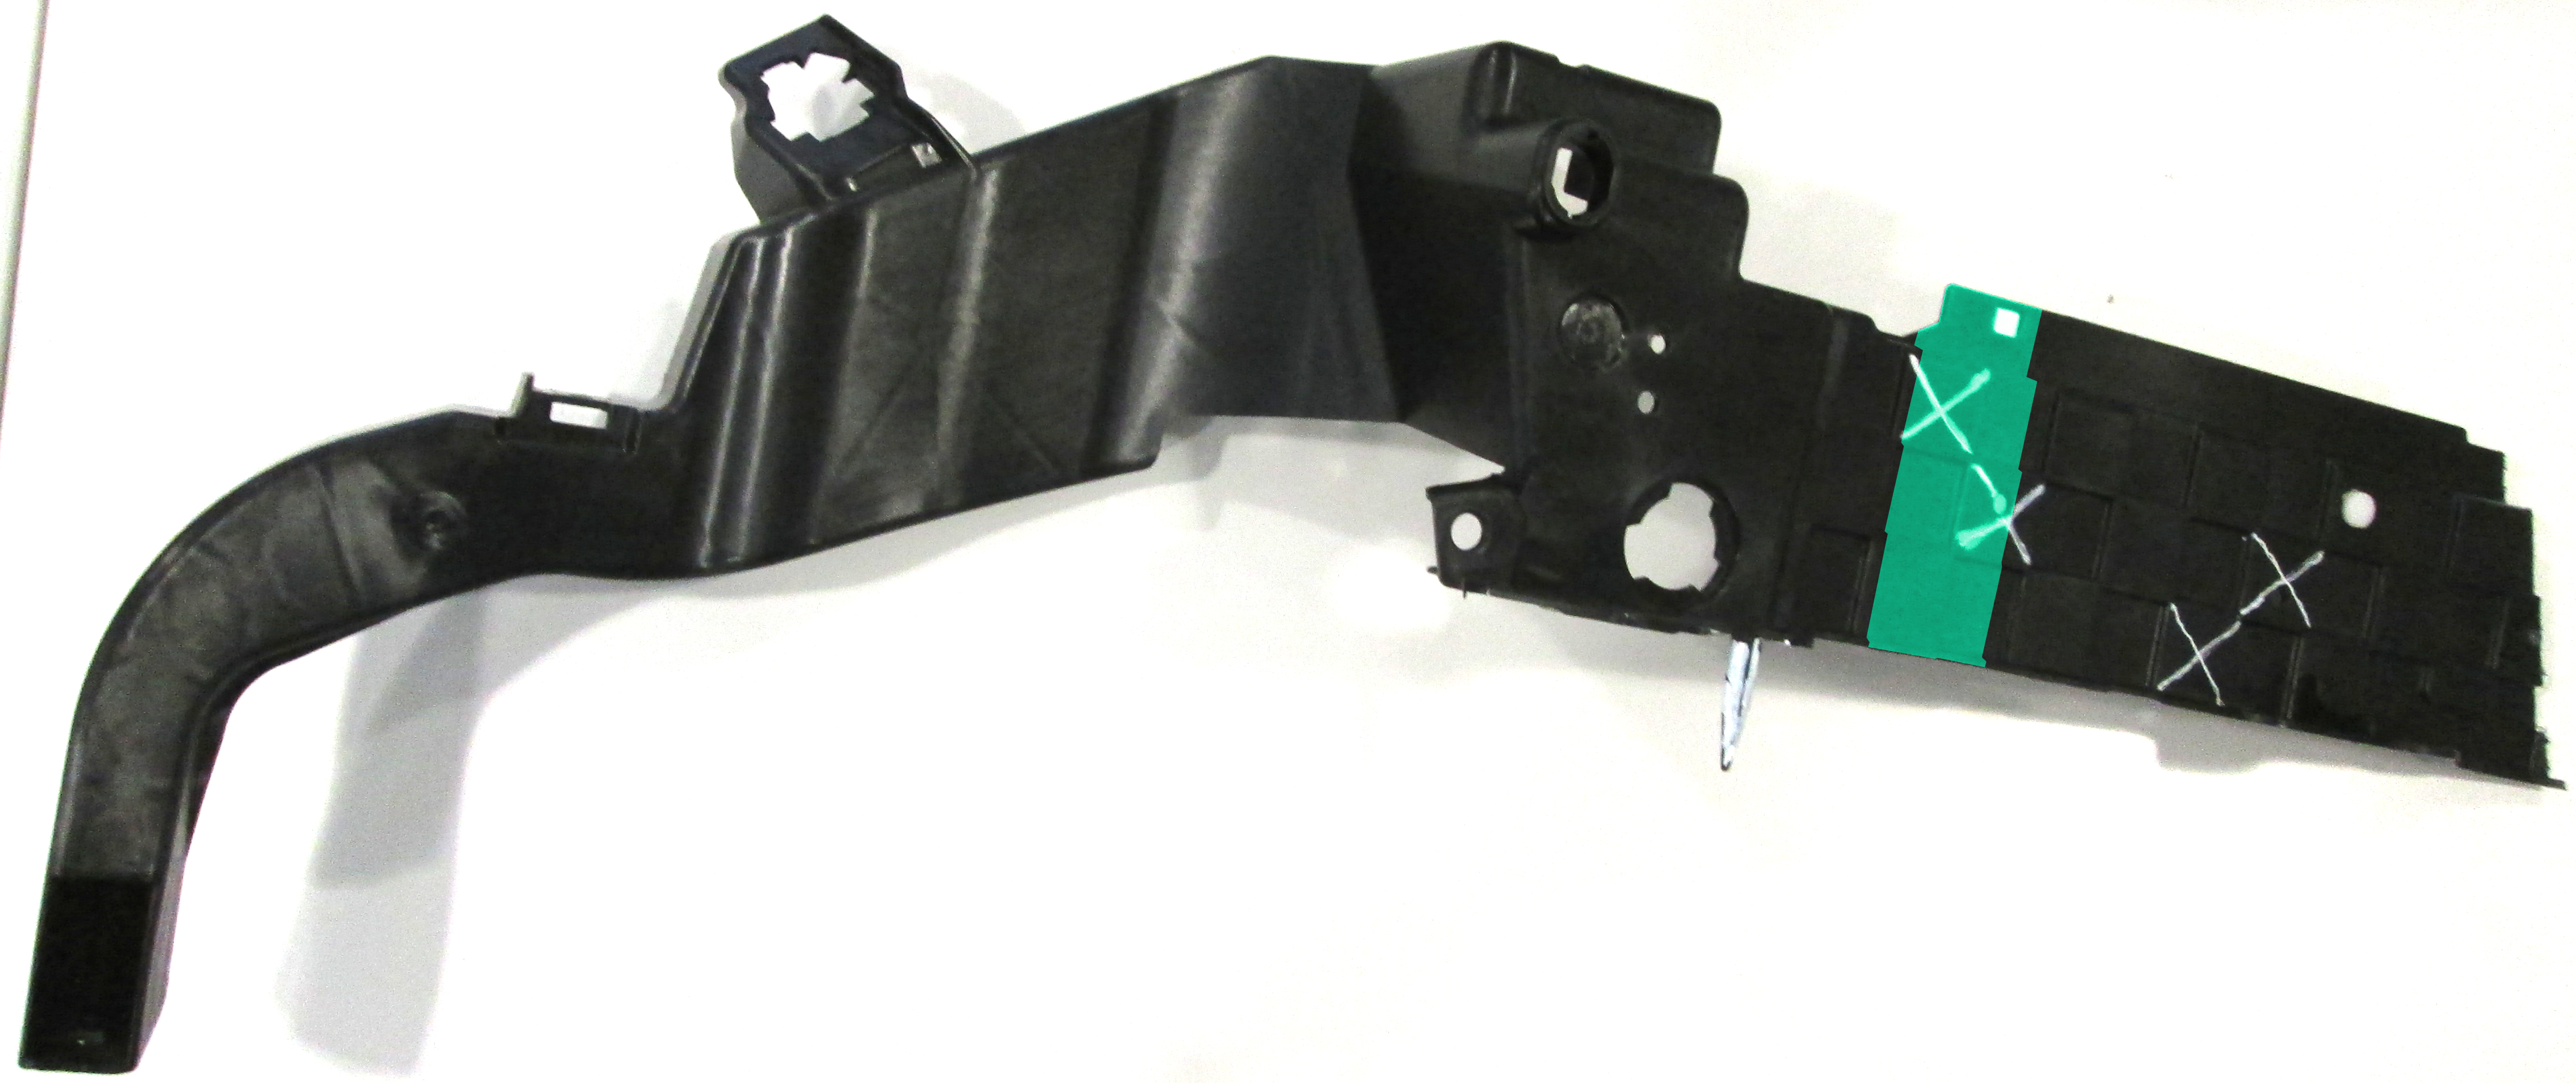
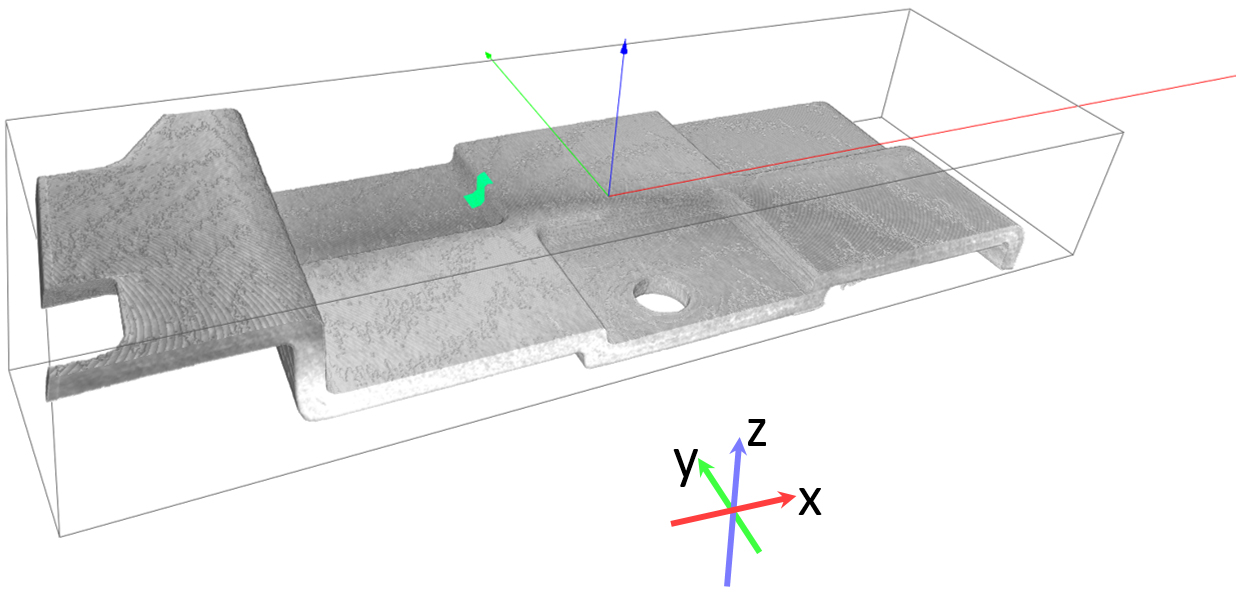
Front carrier from an auto engine compartment
© Fraunhofer ITWM
The (halved) front carrier from an auto engine compartment used for elucidating the measurement method (ROI Method), with four region of interest marked with crosses. The green area is shown in detail in figure 2 (on the right).
Volume rendering of the area marked green in the left image
© Fraunhofer ITWM
Volume rendering of the area marked green in the left image.
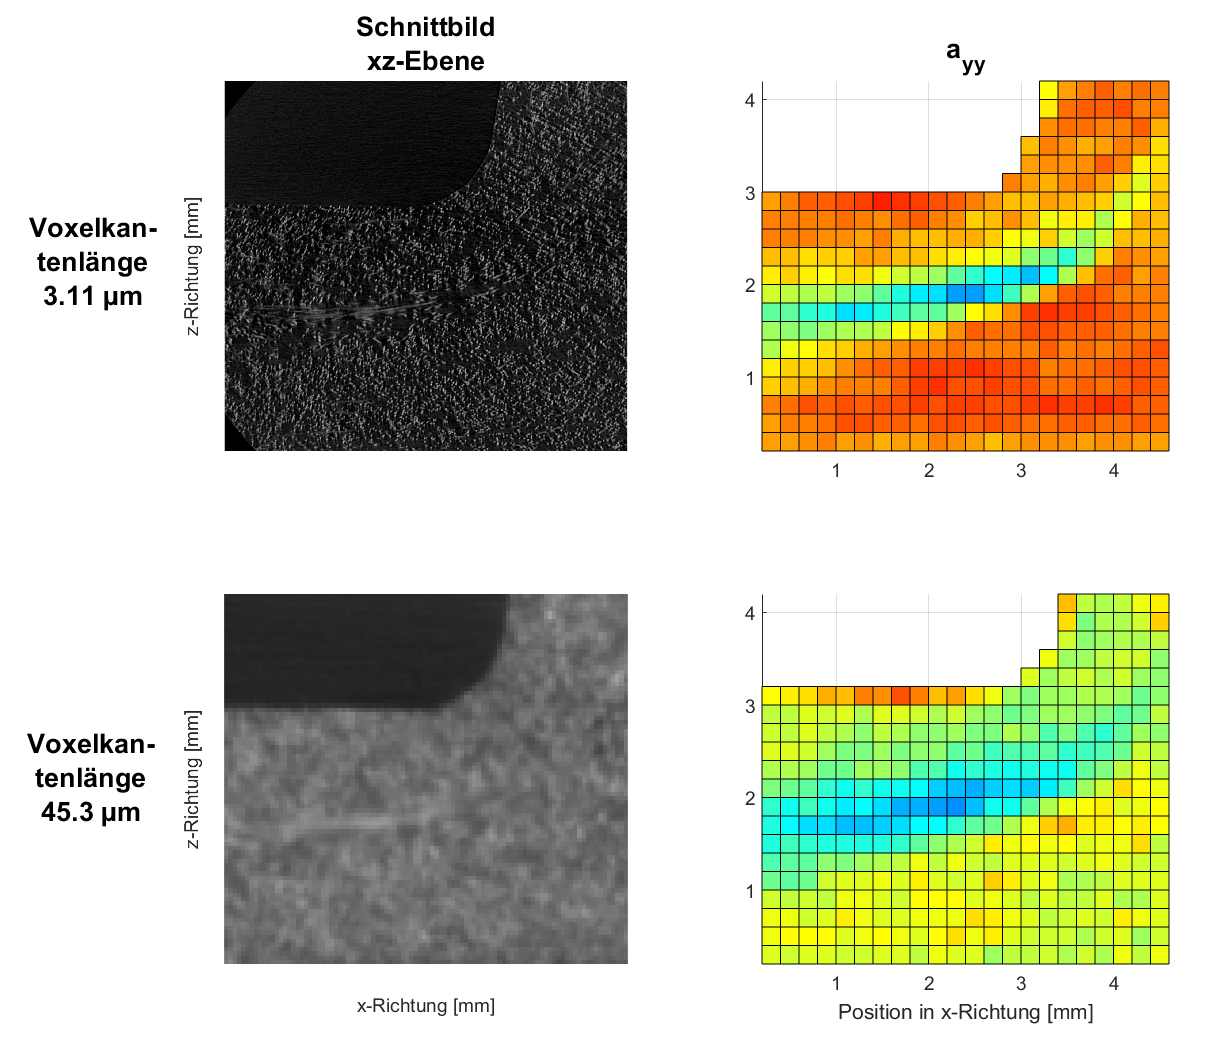
xz-cut images from the 3D images with highest and lowest  resolution and diagonal component of the 3D images measured in the 2nd order orientation tensor in y-direction (injection direction).
© Fraunhofer ITWM
xz-cut images from the 3D images with highest and lowest resolution and diagonal component of the 3D images measured in the 2nd order orientation tensor in y-direction (injection direction).

Reinforcing fibers are also used in the construction industry to improve the mechanical properties, especially the crack resistance of ultra-high strength concrete (UHPC). Fiber distribution and fiber orientation can also be analyzed with MAVI. Fiber pull-out behavior can also be studied using μCT data. 

Publications

Schuler, F.; Breit, W.; Schnell, J.; Rösch, R.:
Möglichkeiten des Einsatzes der Computer-Tomographie bei der Untersuchung von Stahlfaserbetonen.
Betonwerk International, Heft 4, S. 70-72, (2013).

O. Wirjadi, K. Schladitz, P. Easwaran, J. Ohser:
Estimating Fibre Direction Distributions of Reinforced Composites from Tomographic Images.
Image Analysis and Stereology 35, 167-179, (2016).

K. Schladitz, A. Büter, M. Godehardt, O. Wirjadi, J. Fleckenstein, T. Gerster, U. Hassler, K. Jaschek, M. Maisl, U. Maisl, S. Mohr, U. Netzelmann, T. Potyra, M. Steinhauser:
Non-Destructive Characterization of Fiber Orientation in Reinforced SMC as Input for Simulation Based Design.
Composite Structures 160, 195-203, (2017).

Baranowski T.; Dobrovolskij D.; Dremel K.; Hölzing A.; Lohfink G.; Schladitz K.; Zabler S.:
Local fiber orientation from X-ray region-of-interest computed tomography of large fiber reinforced composite components.
Composites Science and Technology, 183: 107786, (2019).


Project »REVIT«

Together with Fraunhofer IWM, we are working on creating microscale models. Based on these, material maps are calibrated for the mechanical characterization of fiber composites.